Service Manager
Using Dashboards
A dashboard is a user-defined summary view of data and can have one or more parts.
When you log in, the application displays the default dashboard for your role (as designated by your administrator). You can create dashboard parts to view data and information in different ways and you can use a single dashboard part on multiple dashboards.
Each role can have a unique designated dashboard and can also create their own dashboard and designate it as their default.
Only administrators can define the default dashboard for each role and determine which roles are allowed to create their own dashboards.
Default Dashboards assigned to a User Role
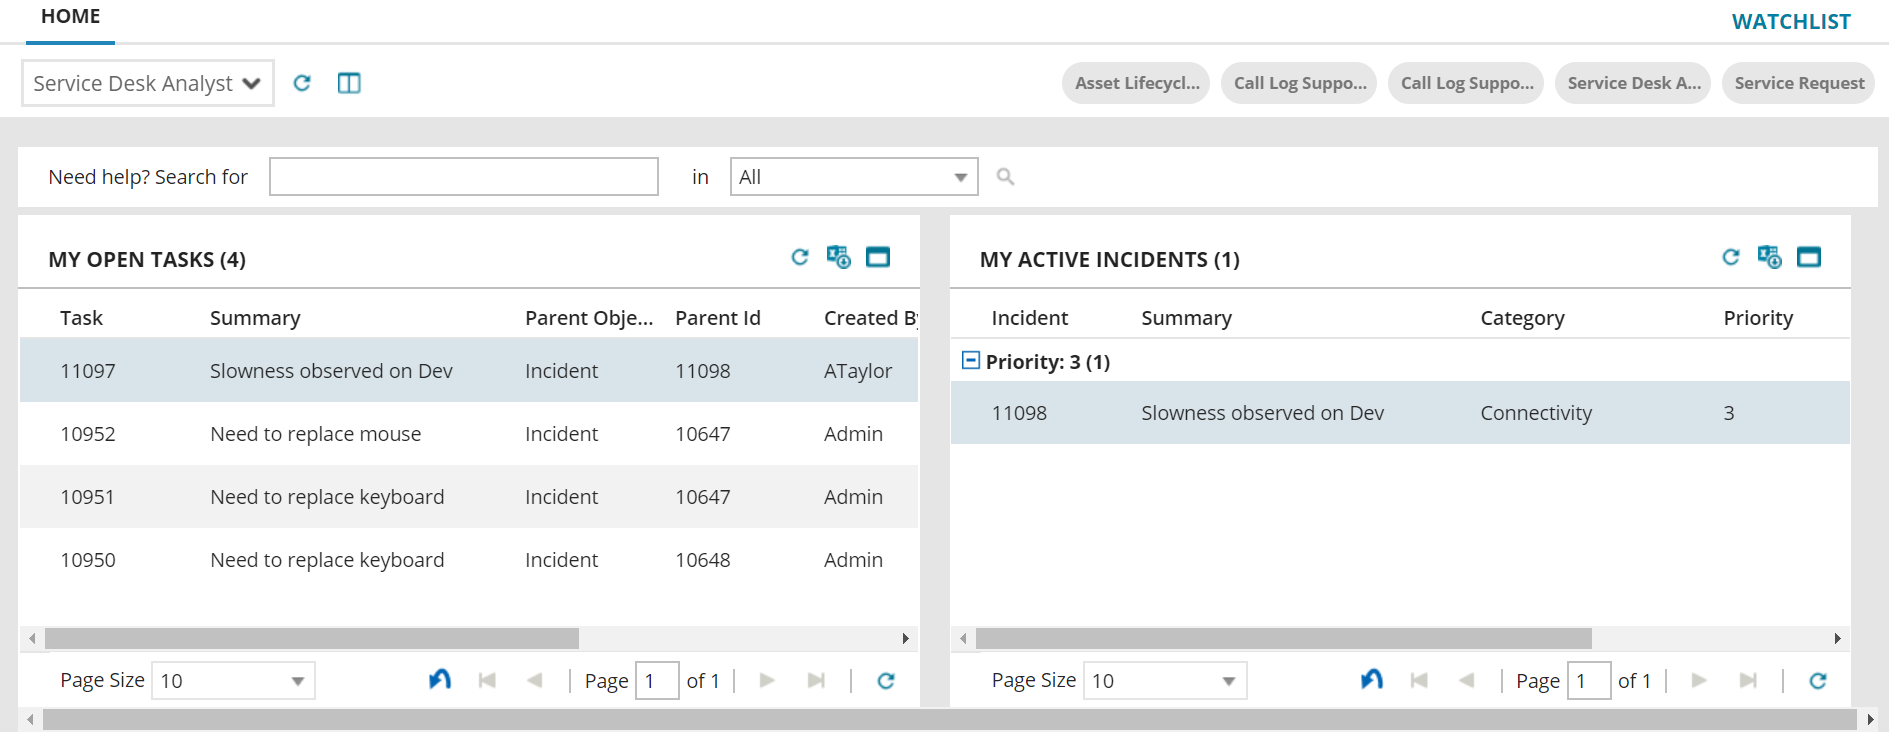
About the "My Dashboards" List
The My Dashboards list is a quick and easy way to access your favorite dashboards. You simply select a dashboard from the list and the application displays it.
You can add your favorite dashboards that you would want to frequently access to the My Dashboards list. Administrators can also add dashboards to this list.
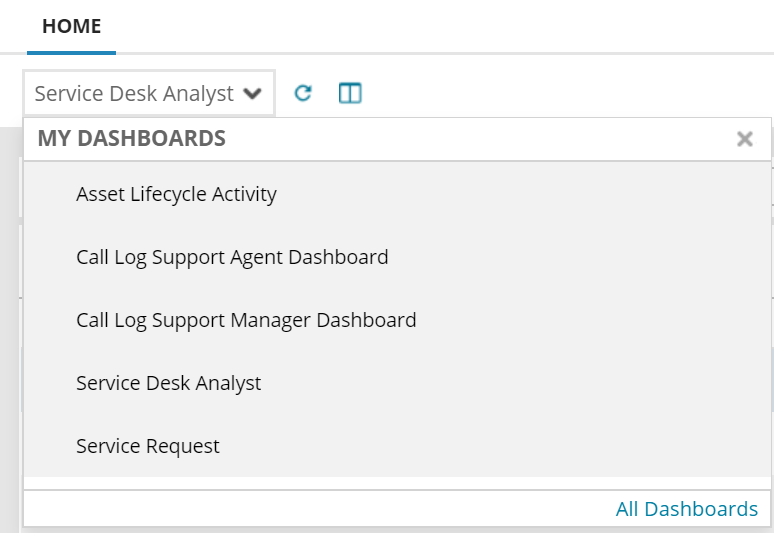
My Dashboards List
Adding a Dashboard to the "My Dashboards" List
When you add a dashboard to the My Dashboards list, the application also adds a graphical icon of that dashboard to the toolbar.
1.Log in to the application.
2.On the Home page, click the down arrow next to the name of your default dashboard.
For example, if you are logged in as a Service Desk Analyst, click on the down arrow next to the words Service Desk Analyst.
3.Click All Dashboards on the bottom right of the drop-down list. The application displays a list of dashboards available to your role.
4.From the Select All column, check the dashboard to add to the My Dashboards list.
5.From the More Actions drop-down menu, choose Add to my dashboards. The value under the My Dashboard column for the dashboard that you selected shows Yes.
The application now displays the dashboard under the My Dashboards list.
Removing a Dashboard from the "My Dashboards" List
1.Log in to the application.
2.On the Home page, click the down arrow next to the name of your default dashboard.
For example, if you are logged in as a Service Desk Analyst, click on the down arrow next to the words Service Desk Analyst.
3.Click All Dashboards on the bottom right of the drop-down list. The application displays a list of dashboards available to your role.
4.From the Select All column, check the dashboard to remove from the My Dashboards list.
5.From the More Actions drop-down list, select Remove from my dashboards. The value under the My Dashboard column for the dashboard that you selected shows a dash.
The dashboard no longer appears under the My Dashboards list.
Designating the Default Dashboard
The dashboard that appears on the Home page when you log in is set up as the default dashboard for your role. You can set up your own default dashboard.
When you set a dashboard as the default, it only appears as the default for you. You must have a default dashboard and only one dashboard can be designated as the default.
1.Log in to the application.
2.On the Home page, click the down arrow next to the name of your default dashboard.
For example, if you are logged in as a Service Desk Analyst, click on the down arrow next to the words Service Desk Analyst.
3.Click All Dashboards on the bottom right of the drop-down list. The application displays a list of dashboards available to your role.
4.From the Select All column, check the dashboard to make the default.
5.From the More Actions drop-down list, select Set as default. The value under the Default column for the dashboard that you selected shows Yes.
6.To change the default dashboard, designate another dashboard as the default.
Maintaining Dashboard List Settings
If you change any of the list settings, they remain constant even when you log out and log back in again.
These settings include:
•Column width
•Sort order for columns: ascending or descending
•Column order
•Hidden or visible columns
•Page size: number of rows per page
•Groupings
Dashboard list personalization applies to an individual list on an individual dashboard. For example, where the same list part is used in different dashboards, you can have different list personalization for each dashboard.
Resetting Personalization in a Dashboard List
Click the reset icon  at the bottom of the dashboard list to reset your changes. For example, if you made some changes to the column width and then click the reset icon, the application reverts to your original settings. Resetting a personalization includes changes to column width, sort order, column order, hidden columns, rows per page, and grouping.
Was this article useful?
Copyright © 2019, Ivanti. All rights reserved.